PHENOTYPIC AND GENOTYPIC VARIATION OF CULTIVATED PANAX QUINQUEFOLIUS
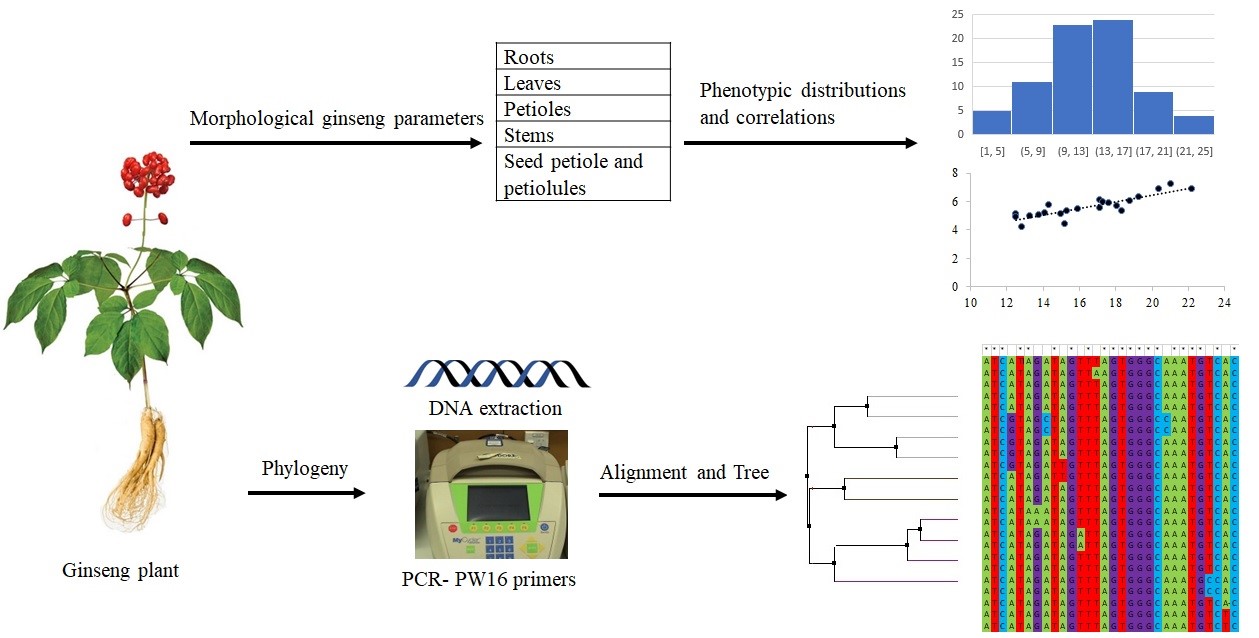
American ginseng (Panax quinquefolius) is highly valued for its medicinal properties, with Ontario emerging as a leading producer. The cultivation began with seeds collected from wild populations, resulting in a potentially diverse crop due to the absence of scientific selection. A study involving 162 American ginseng plants from a commercial garden assessed various morphological traits, such as root grade, stem length, and the fresh and dry weights of roots, leaves, stems, and seeds. The traits exhibited a wide range of values, with significant correlations identified between root and stem weights, root dry weight and leaf dry weight, as well as root and leaf fresh weights.
The plants were genotyped using single nucleotide polymorphisms (SNPs) at the PW16 locus, revealing 22 groups based on sequence relatedness, ranging from no SNPs in some groups to high diversity in others. These SNP groups corresponded with notable differences in certain traits, such as stem length and leaf weight. This research underscores the genetic and phenotypic diversity of cultivated American ginseng grown under consistent environmental conditions. The insights into the relationships between different phenotypes, and between genotype and phenotype, will be instrumental in future selection programs aimed at developing American ginseng cultivars with superior agronomic traits.
Tác giả: Abdurraouf Abaya, Geovanna Cristina Zaro, Alvaro De la Mora Pena, Tom Hsiang, Paul H. Goodwin.
Keywords: American ginseng; commercial production; phenotypic diversity; genotypic diversity; single nucleotide polymorphisms (SNPs); prolyl-tRNA synthetase; plant traits.
|
Chữ viết tắt |
Tên Tiếng Anh |
Tên Tiếng Việt |
|
SNP |
Single Nucleotide Polymorphisms |
Đột biến đơn nucleotide |
|
PCR |
Polymerase Chain Reaction |
Phản ứng chuỗi polymerase |
|
RAPD |
Random Amplified Polymorphic DNA |
DNA đa hình được khuếch đại ngẫu nhiên |
|
ANOVA |
Analysis of Variance |
Phân tích phương sai |
|
LSD |
Least Significant Difference test |
Kiểm tra sự khác biệt nhỏ nhất có ý nghĩa |
|
USDA |
United States Department of Agriculture |
United States Department of Agriculture |
OVERVIEW
1. Introduction of P. quinquefolius:
- Species and Medicinal use: Panax quinquefolius L., commonly known as American ginseng, is cultivated for its roots, which contain medicinal compounds, primarily ginsenosides. These compounds have notable antioxidant, anti-inflammatory, antiapoptotic, and immunostimulatory properties.
- Industry applications: The roots are widely used across the pharmaceutical, cosmetic, and food industries.
2. Native Habitat and Conservation Status:
- Geographical origin: American ginseng is native to the hardwood forests of south-central Canada and the eastern United States.
- Legal protection: In Canada, wild harvesting of American ginseng has been illegal since 2007 following its inclusion in the Endangered Species Act.
3. Cultivation in Ontario:
- Major producer: Ontario is a leading producer of cultivated American ginseng, with an annual production value of approximately USD 250 million between 2014 and 2017.
- Cultivation practices: The cultivation process involves using seeds from previous crops, planting in raised beds of fumigated soil, employing artificial shades, and using intensive practices such as pesticides and fertilization. The roots are typically harvested in the third or fourth year of growth.
4. Genetic diversity and Unknown genotypes:
- Seed origin: The seeds used for cultivation were initially collected randomly from wild populations, leading to unknown genotypes in the cultivated crop.
- Landraces: Despite the random initial collection, landraces have developed from selective breeding by growers, focusing on traits like root shape and berry color.
5. Phenotyping and its Importance:
- Definition and Purpose: Phenotyping involves observing and measuring morphological, physiological, and biochemical traits to characterize diversity and variation within plant populations.
- Previous studies: While there are studies on phenotyping wild American ginseng, most literature on cultivated ginseng reports only average phenotypes. Environmental conditions significantly influence phenotypic traits.
6. Genotyping Techniques:
- Approaches: Various methods are used for genotyping ginseng, including isozymes, restriction fragment length polymorphisms, PCR product length polymorphisms, and DNA sequence analysis.
- SNP Analysis: Single nucleotide polymorphisms (SNPs) provide precise genetic variation assessments. SNPs from databases such as Panax dbEST have revealed high nucleotide diversity, with loci like PW16 showing significant haplotype diversity.
7. Objectives of the Study:
- Aim: The study aimed to phenotype and genotype a collection of cultivated American ginseng plants to understand their genetic diversity and morphological variation.
- Environmental control: To minimize environmental impacts on phenotypes, plants of the same age were collected from a single raised bed in a commercial garden.
8. Study findings:
- Phenotypic traits: The study measured various morphological traits, such as root grade, stem length, and the fresh and dry weights of roots, leaves, stems, and seeds.
- Genotypic groups: SNP analysis at the PW16 locus identified 22 groups with varying sequence relatedness. Correlations between genetic markers and morphological traits, such as stem length and leaf weight, were significant.
- Implications: These findings highlight the genetic and phenotypic diversity of cultivated American ginseng and provide valuable insights for future selection and breeding programs aimed at developing cultivars with desirable agronomic traits.
MATERIALS AND METHODS
1. Plant Material and Measurements:
Plant Material: The P. quinquefolius plants for this study were harvested from a 4 m² area in the center of a shaded 3-year-old commercial ginseng garden near Simcoe, Ontario, on 20 August 2019. The sample collection included entire plants comprising roots, leaves, petioles, stems, and seeds with seed petioles. In the laboratory, the roots were washed with tap water to remove all visible soil particles. The roots were then characterized by grade into spider, chunk, forked, or pencil categories. Root color was assessed using “The Official Visual Aids (USDA)” standards, converted to numerical values for quantitative analysis: light (1), light medium (2), medium (3), dark medium (4), and dark (5). Fresh weight of the roots was determined after washing and removing excess moisture with paper towels, while dry weight was measured after drying the roots at 60 °C for 72 hours.
Measurements: In addition to root analysis, the study involved detailed measurements of petioles, leaves, and leaflets. The number of petioles, leaves, and leaflets per plant were recorded, along with their fresh and dry weights. Leaf area was measured using a LI-COR LI-3100C Area Meter (LI-COR Inc., Lincoln, NE, USA). Stem length per plant and the fresh and dry weights of the stems were also recorded. Furthermore, the study counted the number of green and red seeds, seed petioles, and seed petiole lengths per plant, along with measuring their fresh and dry weights. These comprehensive measurements provided a robust dataset for analyzing the morphological traits and potential correlations in cultivated American ginseng.
2. Phylogeny:
Definition: Phylogeny refers to the evolutionary history and relationships among species or groups of organisms. These relationships are often represented in a phylogenetic tree, or phylogram, which illustrates the lineage and divergence of different species from common ancestors.
Methodology: Root samples from individual P. quinquefolius plants were stored at −80 °C, and DNA was extracted following Edwards et al. The extracted DNA was stored at −20 °C. PCR was conducted in a final volume of 20 μL, including DNA extract, primers, PCR water, buffer, Mg++, dNTP, and Tsg polymerase. The forward primer PW16F was paired with a newly designed reverse primer PW16R to amplify a 740 bp region of the prolyl-tRNA synthetase gene. PCR conditions included an initial denaturation at 94 °C for 3 minutes, followed by 25 cycles of 30 seconds at 94 °C, 60 seconds at 62 °C, and 60 seconds at 72 °C, and a final extension at 72 °C for 10 minutes. The PCR products were examined via electrophoresis in a 1.5% agarose gel.
Sequencing was performed at the Agriculture & Food Laboratory at the University of Guelph, and sequence identity was confirmed by comparing the sequences to the GenBank nr database using BLASTn. Sequence alignment was carried out with MUSCLE, and a maximum-likelihood phylogram was generated using MEGA-X software with 1000 bootstrap replications, displaying percentage values on the branches for support.
3. Statistical Analysis:
Data visualization: Histograms were created using Excel (Microsoft) v2208 to show the distribution of each measured factor per plant. Each measurement was divided by the root grade of each plant to provide a clear comparative visual representation.
Data analysis:
- Separation by Genotype: All phenotype trait data were separated according to the PW16 genotype group.
- ANOVA: These data were subjected to analysis of variance (ANOVA) using the GLM procedure of SAS version 9.4 (SAS Institute, Cary, NC, USA) to determine if there were significant differences among the groups.
Post-Hoc Testing: When significant differences (p < 0.05) were detected through ANOVA, Fisher’s Least Significant Difference Test (p = 0.05) was used to compare the means of different groups.
Correlation Analysis: Linear regression analysis was conducted using R (version 4.3.1) with the “corrplot” and “Hmisc” packages to determine the relationships between different traits, providing insights into how various factors interrelate.
RESULTS
1. Morphological ginseng parameters:
a. Plant Density and Root Grades
In a 4 m² area of a cultivated bed, 162 ginseng plants were sampled, resulting in an average plant density of 40.5 plants per m². The distribution of root grades among these plants was as follows: pencil (79 plants), fork (34 plants), spider (31 plants), and chunk (18 plants). Nearly all plants (160 out of 162) had one stem per root, with only two exceptions. Sampling occurred during seed ripening, with 152 plants bearing seed heads.
b. Root characteristics
- Fresh and Dry weights: The fresh weight of roots per plant ranged from 3.58 g to 42.68 g, averaging 16.66 g (Figure 1A). Pencil roots exhibited significantly lower fresh weights compared to other grades (Table S1). Dry weights ranged from 0.30 g to 14.07 g, averaging 4.74 g (Figure 1B), with pencil roots showing significantly lower values (Table S1).
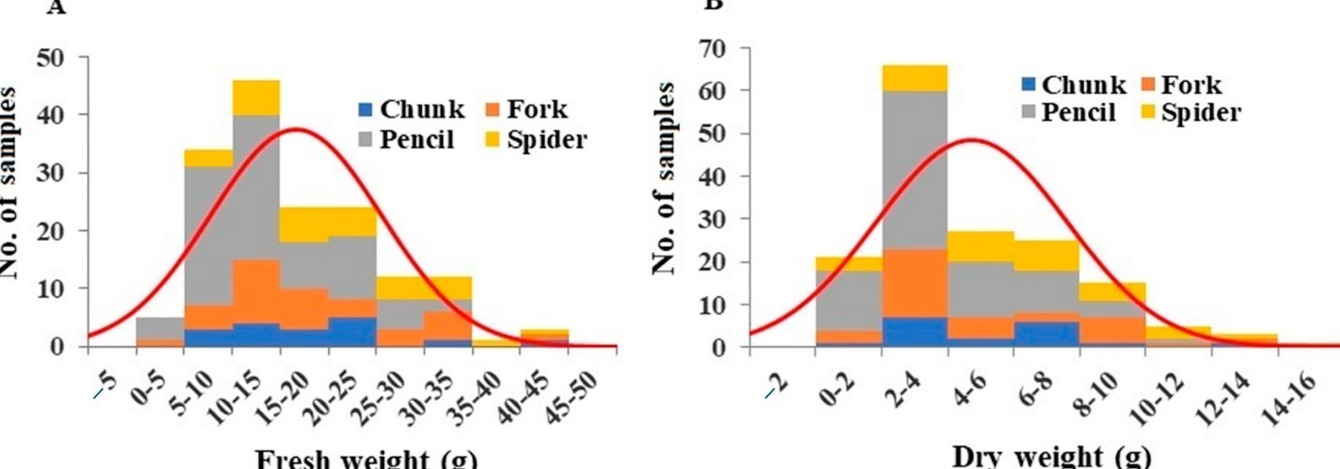
Figure 1: Distribution of root fresh weight (A) and dry weight (B) among the plant samples. Division of samples by root grade is also shown.
- Water content: The average root water content was 27.76%. Chunk roots had the highest water content, while forked roots had the lowest (Table S1).
Table S 1: Root parameters separated by root grade.
|
Root grade |
Root fresh wt (g) |
Root dry wt (g) |
Water content (%) |
|||
|
Pencil |
13.50 |
Ba |
3.85 |
B |
28.17 |
A |
|
Chunk |
18.31 |
A |
5.27 |
A |
29.58 |
A |
|
Fork |
18.78 |
A |
5.49 |
A |
26.66 |
A |
|
Spider |
21.36 |
A |
5.98 |
A |
26.87 |
A |
a: Values within a column followed by a letter in common are not significantly different at p = 0.05 according to Fisher’s protected Least Significant Difference test (LSD).
c. Leaf and Leaflet characteristics
- Number and Area: The average number of leaves per plant was 3.00, ranging from 2 to 6 (Figure 2A). Leaflet number per plant averaged 13.65, ranging from 6 to 29 (Figure 2B). Pencil root grade plants had significantly more leaflets compared to other grades (Table S2). Leaf area per plant ranged from 5.03 cm² to 76.03 cm², averaging 26.45 cm² (Figure 2C). Pencil root grade plants exhibited significantly smaller leaf areas than other grades (Table S2).
- Leaf and Petiole weights: Fresh leaf weights ranged from 1.39 g to 13.50 g, averaging 5.71 g (Figure 2D). Pencil root grade leaves had significantly lower fresh weights (Table S2). Leaf dry weights ranged from 0.016 g to 2.285 g, averaging 0.667 g (Figure 2E). Pencil root grade leaves had significantly lower dry weights compared to spider root grade plants (Table S2).
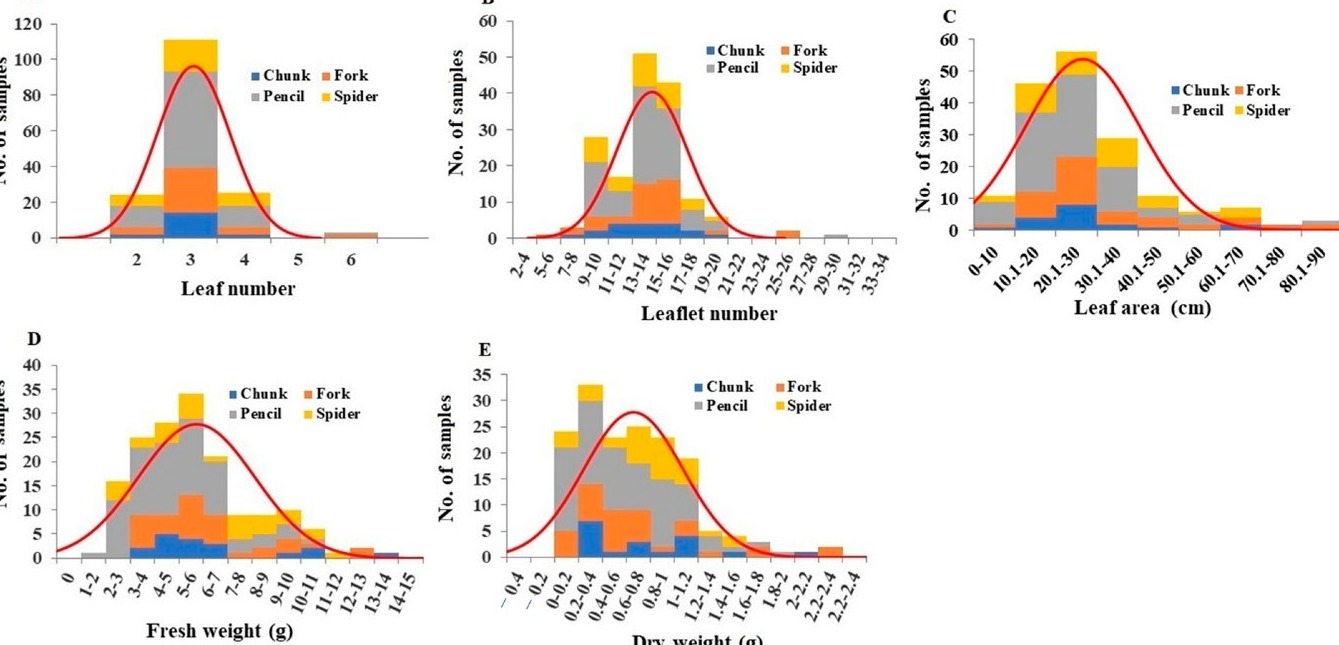
Figure 2: Distribution of leaf number (A), leaflet number (B), leaf area (C), leaves fresh weight (D), and leaves dry weight (E) among the plant samples. Division of samples by root grade is also shown.
Table S 2: Leaf parameters separated by root grade.
|
Root grade |
Leaves per plant |
|
Leaflets per plant |
|
Leaf area (cm) |
|
Leaf fresh wt (g) |
Leaf dry wt (g) |
Water content (%) |
|||
|
Pencil |
3.04 |
Aa |
13.84 |
B |
23.15 |
B |
4.97 |
B |
1.34 |
B |
28.65 |
A |
|
Chunk |
3.00 |
A |
13.56 |
A |
28.81 |
A |
6.47 |
A |
1.60 |
A |
25.80 |
B |
|
Fork |
3.09 |
A |
13.50 |
A |
29.80 |
A |
6.35 |
A |
1.58 |
A |
25.99 |
B |
|
Spider |
3.03 |
A |
13.39 |
A |
29.70 |
A |
6.52 |
A |
1.61 |
A |
26.45 |
AB |
a : Values within a column followed by a letter in common are not significantly different at p = 0.05 according to Fisher’s protected Least Significant Difference test (LSD).
- Petioles: Fresh weights of leaf petioles ranged from 0.39 g to 3.85 g, averaging 1.70 g (Figure 3A). Pencil root grade plants showed significantly lower fresh weights of petioles (Table S3). Dry weights ranged from 0.044 g to 0.581 g, averaging 0.22 g (Figure 3B), with pencil root grade plants having significantly lower values (Table S3).
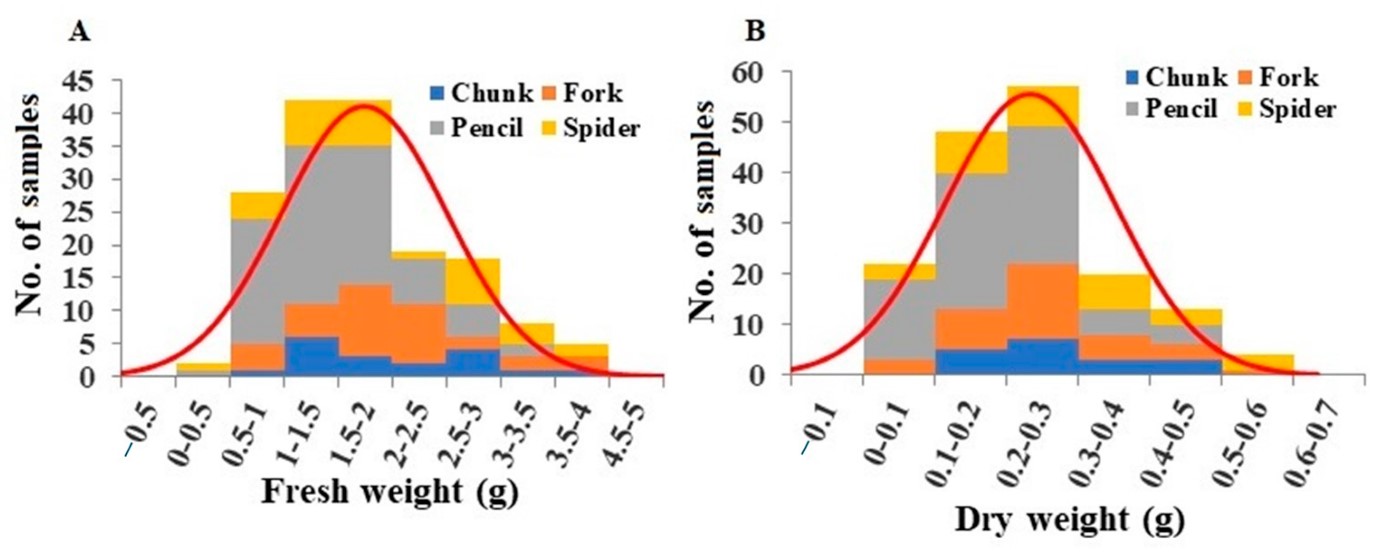
Figure 3: Distribution of leaf petiole fresh weight (A) and leaf petiole dry weight (B) among the plant samples. Division of samples by root grade is also shown.
d. Stem characteristics
Stem length per plant ranged from 16.5 cm to 42.0 cm, averaging 30.06 cm (Figure 4A). Pencil root grade plants exhibited significantly shorter stem lengths compared to chunk root grade plants (Table S3). Fresh stem weights ranged from 1.18 g to 11.04 g, averaging 4.76 g (Figure 4B). Pencil root grade plants had significantly lower fresh weights (Table S3). Dry weights ranged from 0.03 g to 1.82 g, averaging 0.67 g (Figure 4C), with pencil root grade plants showing significantly lower values (Table S3).
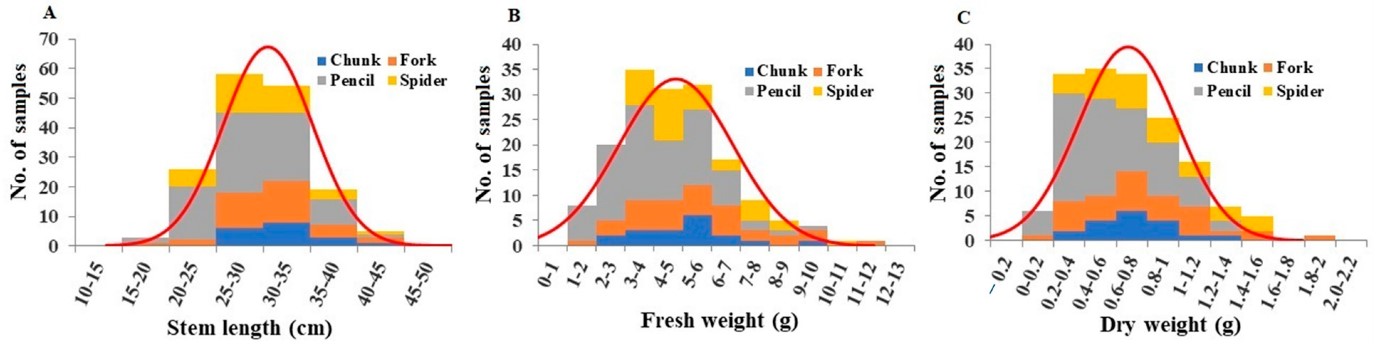
Figure 4: Distribution of stem length (A), stem fresh weight (B), and stem dry weight (C) among the plant samples. Division of samples by root grade is also shown.
e. Seed petioles and Seeds
- Petiole length and weight: Seed petiole lengths varied from 0.5 cm to 22 cm, averaging 10.45 cm (Figure 5A). Fresh weights ranged from 0.03 g to 1.5 g, averaging 0.47 g (Figure 5B). Pencil root grade plants had significantly lower fresh weights of seed petioles compared to spider root grade plants (Table S4). Dry weights ranged from 0.01 g to 0.39 g, averaging 0.12 g (Figure 5C), with pencil root grade plants showing significantly lower values (Table S4).
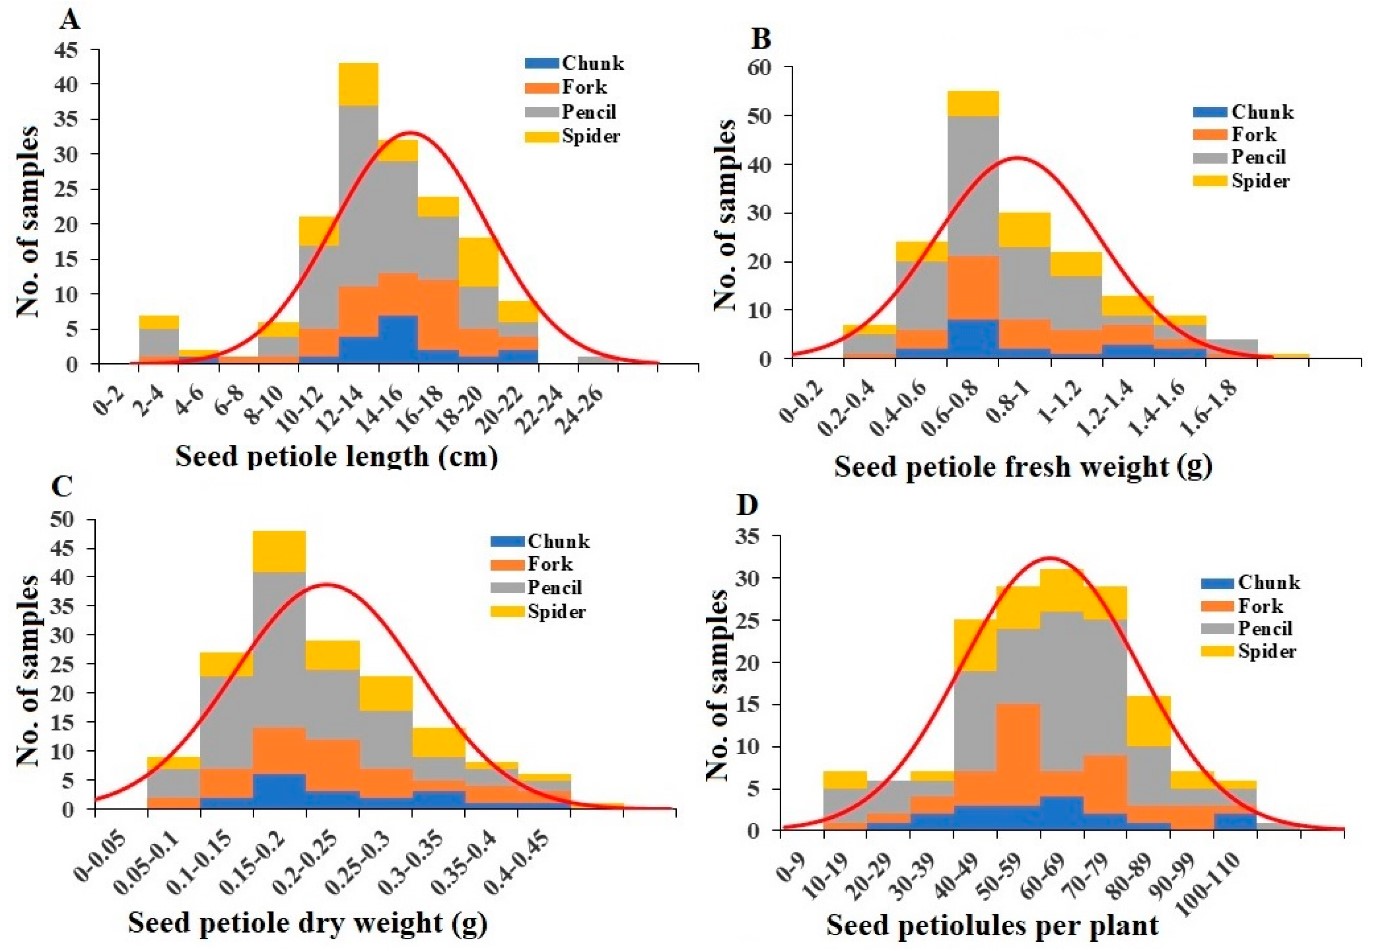
Figure 5: Distribution of seed petiole length (A), seed petiole fresh weight (B), seed petiole dry weight (C), and seed petiolule number per plant (D) among the plant samples. Division of samples by root grade is also shown.
- Seed characteristics: The total number of seeds per plant ranged from 0 to 65, averaging 18.76 (Figure 6A). Red seeds per plant ranged from 0 to 39, averaging 5.69 (Figure 6B), and green seeds per plant ranged from 0 to 58, averaging 13.07 (Figure 6C). Total seed fresh weight per plant ranged from 0.01 g to 13.64 g, averaging 1.94 g (Figure 6D). Total seed dry weight per plant ranged from 0.03 g to 2.77 g, averaging 0.41 g (Figure 6E). The average total seed water content was 21.05%, with chunk and forked grade plants showing the highest and lowest water contents, respectively (Table S4).
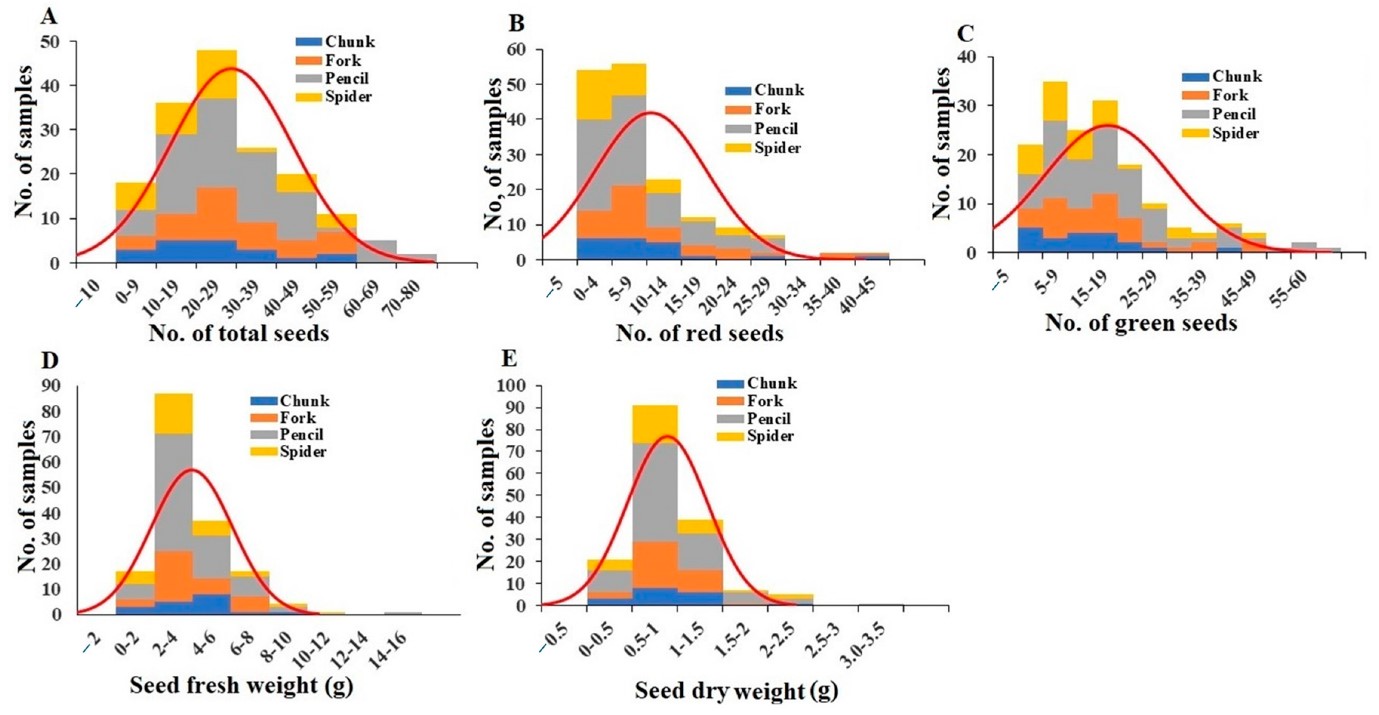
Figure 6: Distribution of total seed number (A), red seed number (B), green seed number (C), seed fresh weight (D), and seed dry weight (E) among the plant samples. Division of samples by root grade is also shown.
Table S 3: Petiole and stem parameters separated by root grade.
|
Root grade |
Petiole fresh wt (g) |
Petiole dry wt (g) |
Water content (%) |
Stem length (cm) |
Stem fresh wt (g) |
Stem dry wt (g) |
Water content (%) |
|||||||
|
Pencil |
09.82 |
Aa |
0.42 |
B |
0.10 |
B |
29.23 |
B |
4.16 |
B |
0.58 |
B |
13.50 |
A |
|
Chunk |
10.89 |
A |
0.52 |
AB |
0.14 |
A |
32.13 |
A |
4.96 |
AB |
0.71 |
AB |
14.30 |
A |
|
Fork |
11.33 |
A |
0.50 |
AB |
0.14 |
A |
31.11 |
AB |
5.53 |
A |
0.78 |
A |
13.87 |
A |
|
Spider |
11.04 |
A |
0.56 |
A |
0.14 |
A |
30.10 |
AB |
5.46 |
A |
0.82 |
A |
14.77 |
A |
a : Values within a column followed by a letter in common are not significantly different at p = 0.05 according to Fisher’s protected Least Significant Difference test (LSD).
Table S 4: Seed parameters separated b root grade.
|
Root grade |
Seed petiole length |
Seed petioles fresh wt (g) |
Seed petioles dry wt (g) |
Water content (%) |
Seed petiolules per plant |
Total seeds per plant |
Seed fresh wt (g) |
Seed dry wt (g) |
Water content (%) |
|||||||||
|
Pencil |
09.82 |
Aa |
0.42 |
B |
0.10 |
B |
23.64 |
A |
42.59 |
A |
0.52 |
A |
1.98 |
A |
0.43 |
A |
19.43 |
A |
|
Chunk |
10.89 |
A |
0.52 |
AB |
0.14 |
A |
27.58 |
A |
39.94 |
A |
0.66 |
A |
2.06 |
A |
0.44 |
A |
21.33 |
A |
|
Fork |
11.33 |
A |
0.50 |
AB |
0.14 |
A |
27.52 |
A |
45.54 |
A |
0.63 |
A |
1.97 |
A |
0.38 |
A |
18.71 |
A |
|
Spider |
11.04 |
A |
0.56 |
A |
0.14 |
A |
24.15 |
A |
44.29 |
A |
0.70 |
A |
1.74 |
A |
0.38 |
A |
20.70 |
A |
a : Values within a column followed by a le????er in common are not significantly different at p = 0.05 according to Fisher’s protected Least Significant Difference test (LSD).
2. Phenotypic correlations:
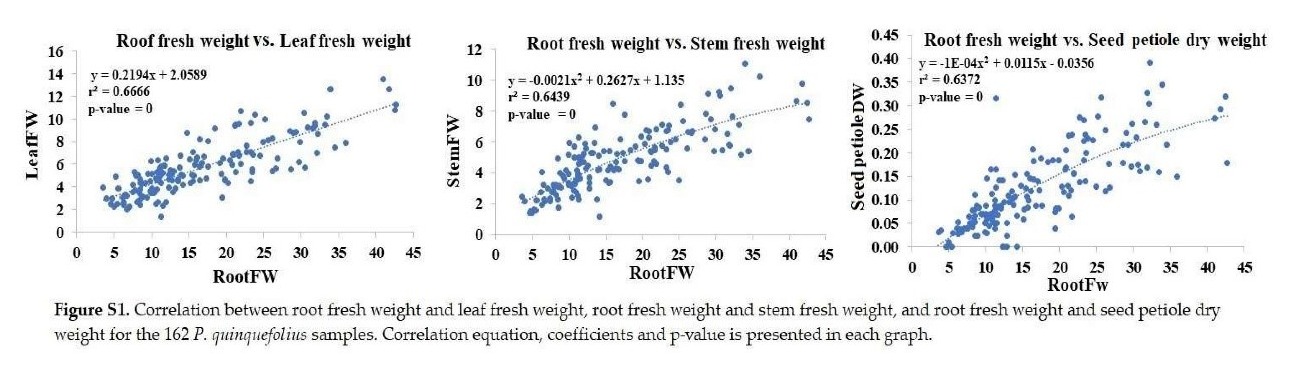
There were significant positive correlations among various phenotypic parameters measured (Figure 7):
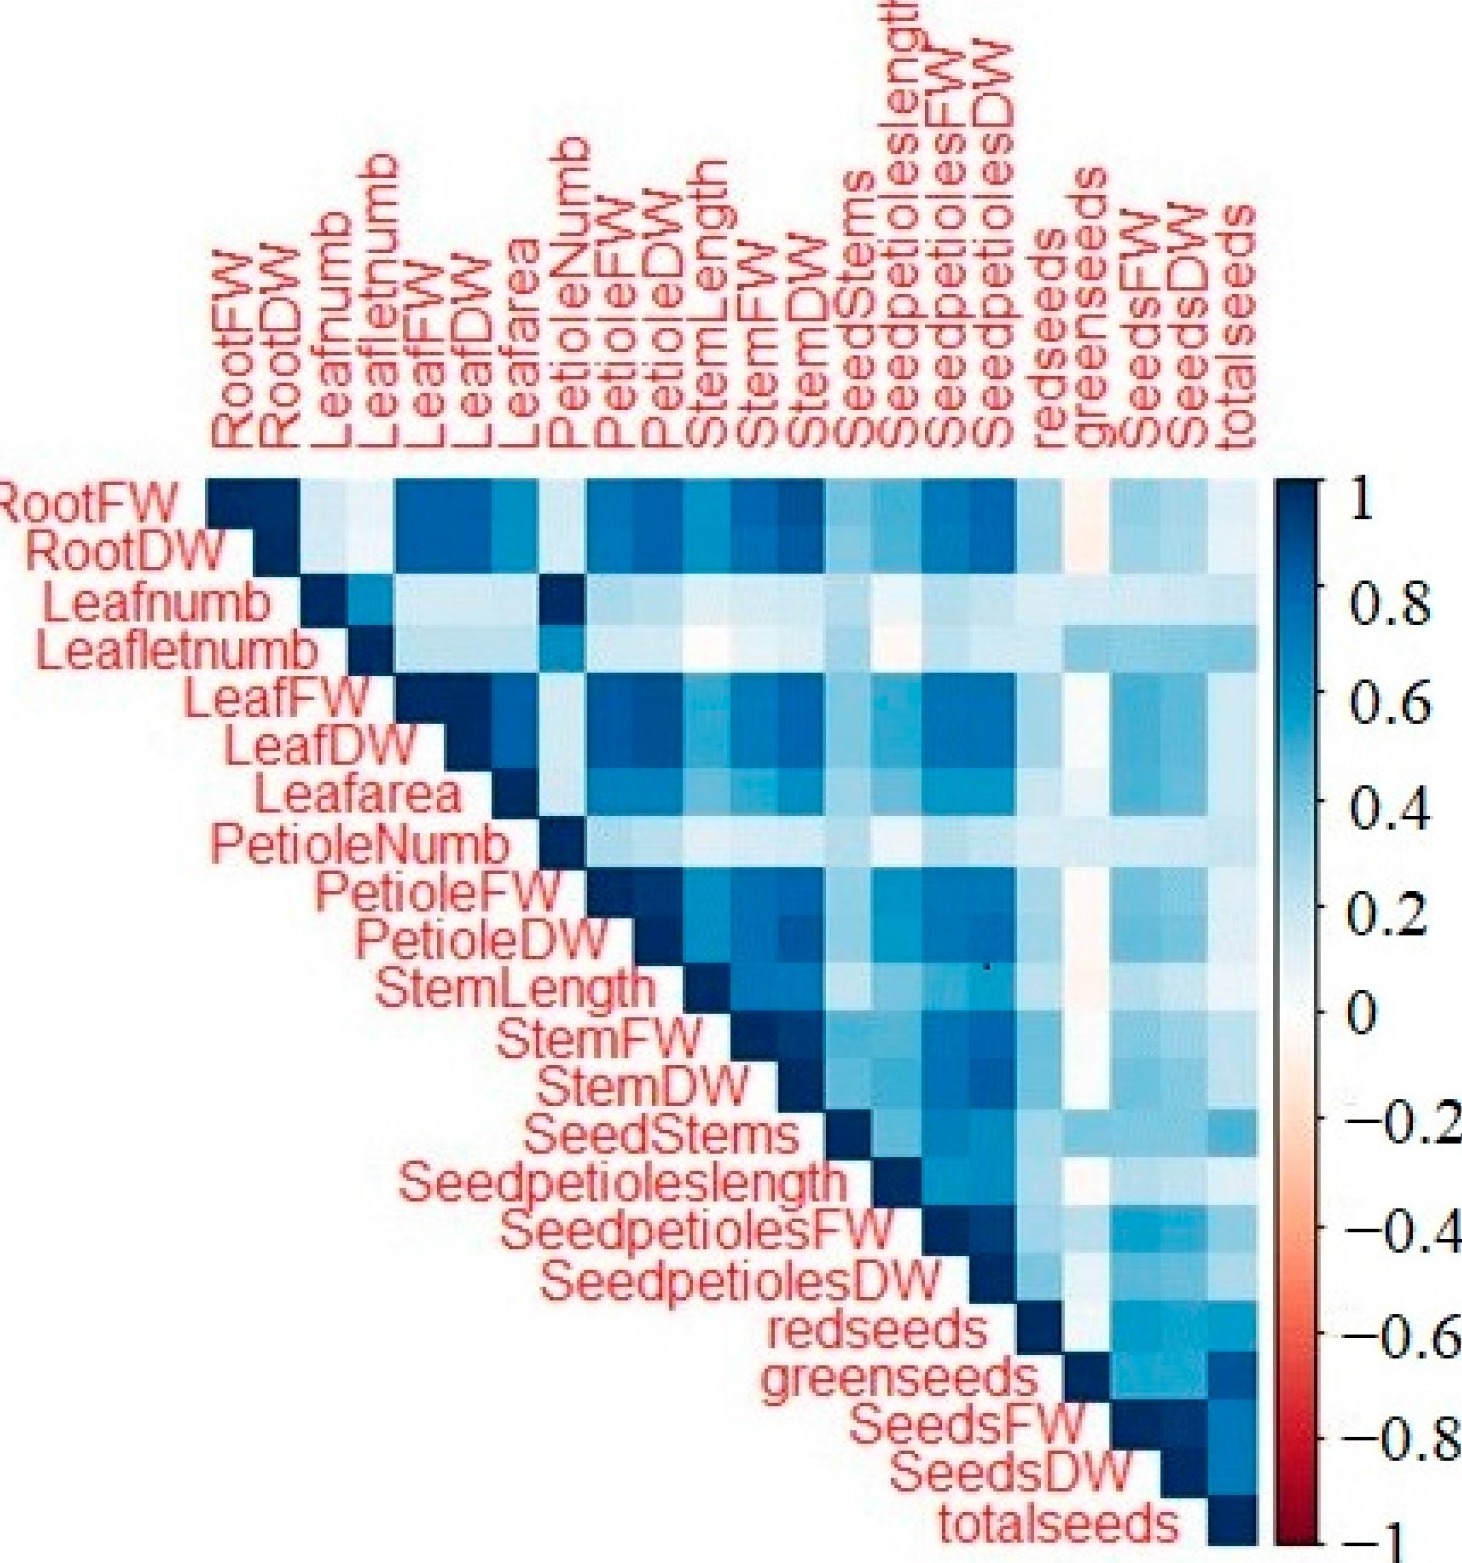
Figure 7: Correlations between different phenotypic parameters of the samples.
+ Root fresh weight: Significantly correlated with leaf and stem fresh weights, and seed petiole dry weight (Figure S1).
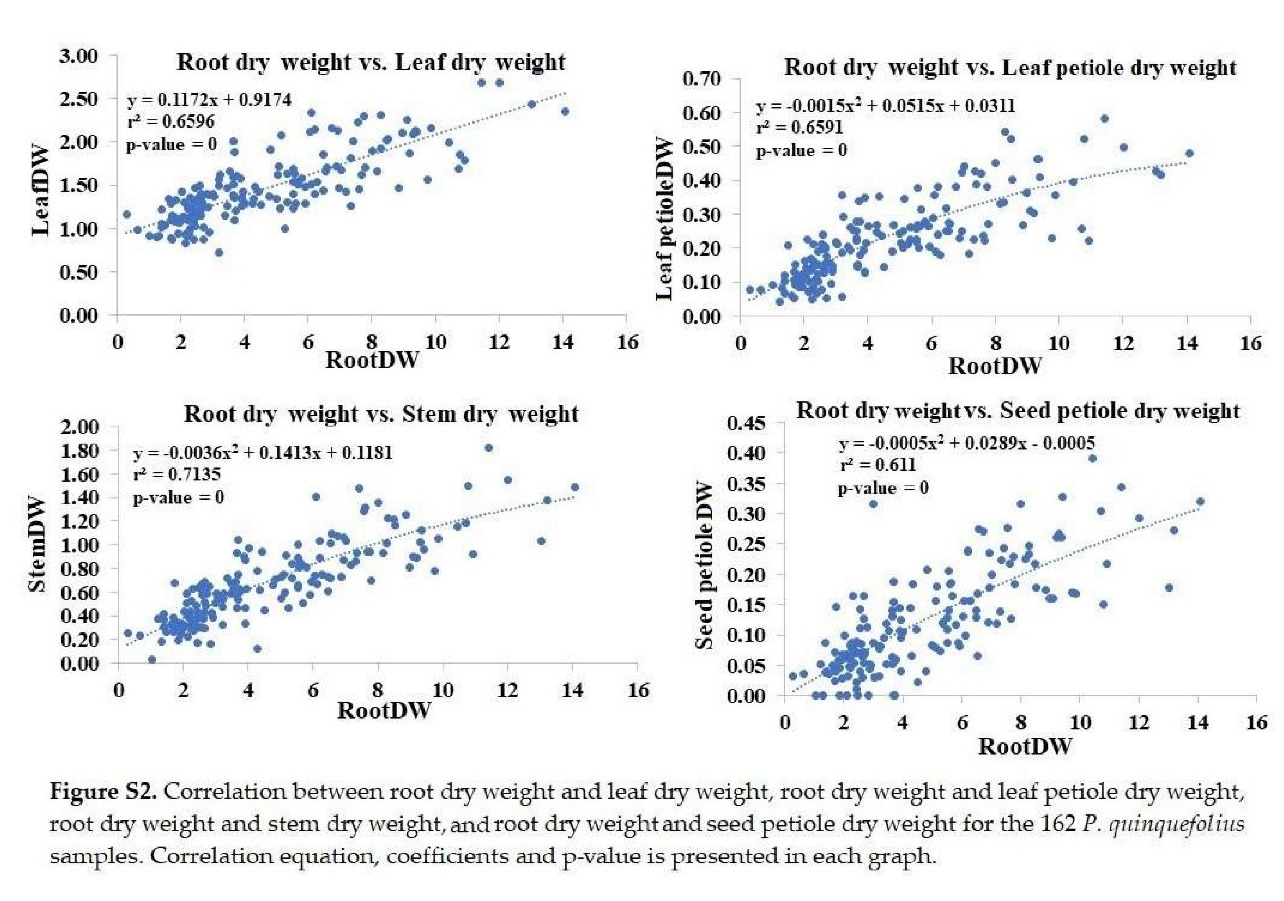
+ Root dry weight: Significantly correlated with leaf, petiole, stem, and seed petiole dry weights (Figure S2).
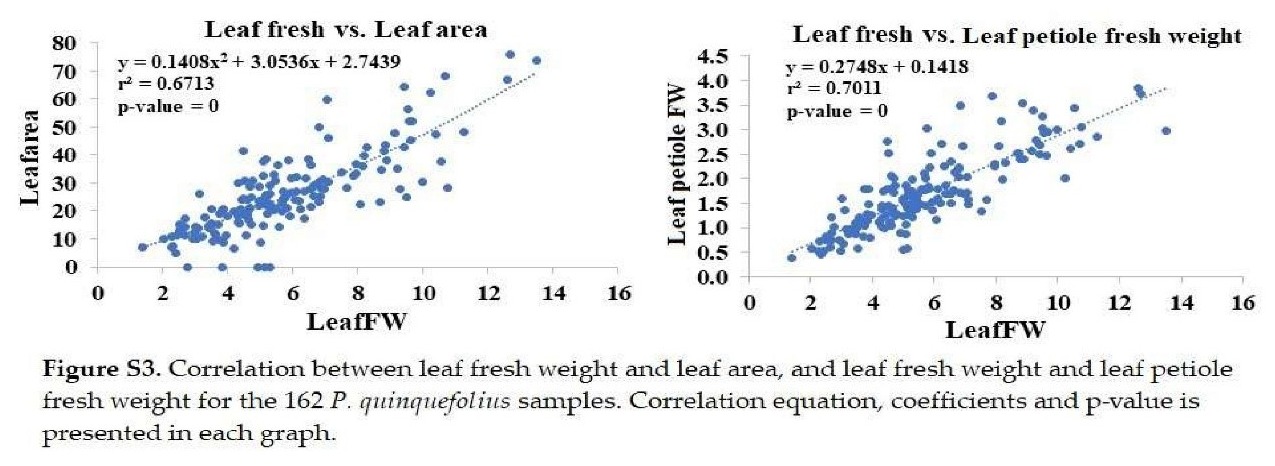
+ Leaf fresh weight: Significantly correlated with leaf area and petiole fresh weight (Figure S3).
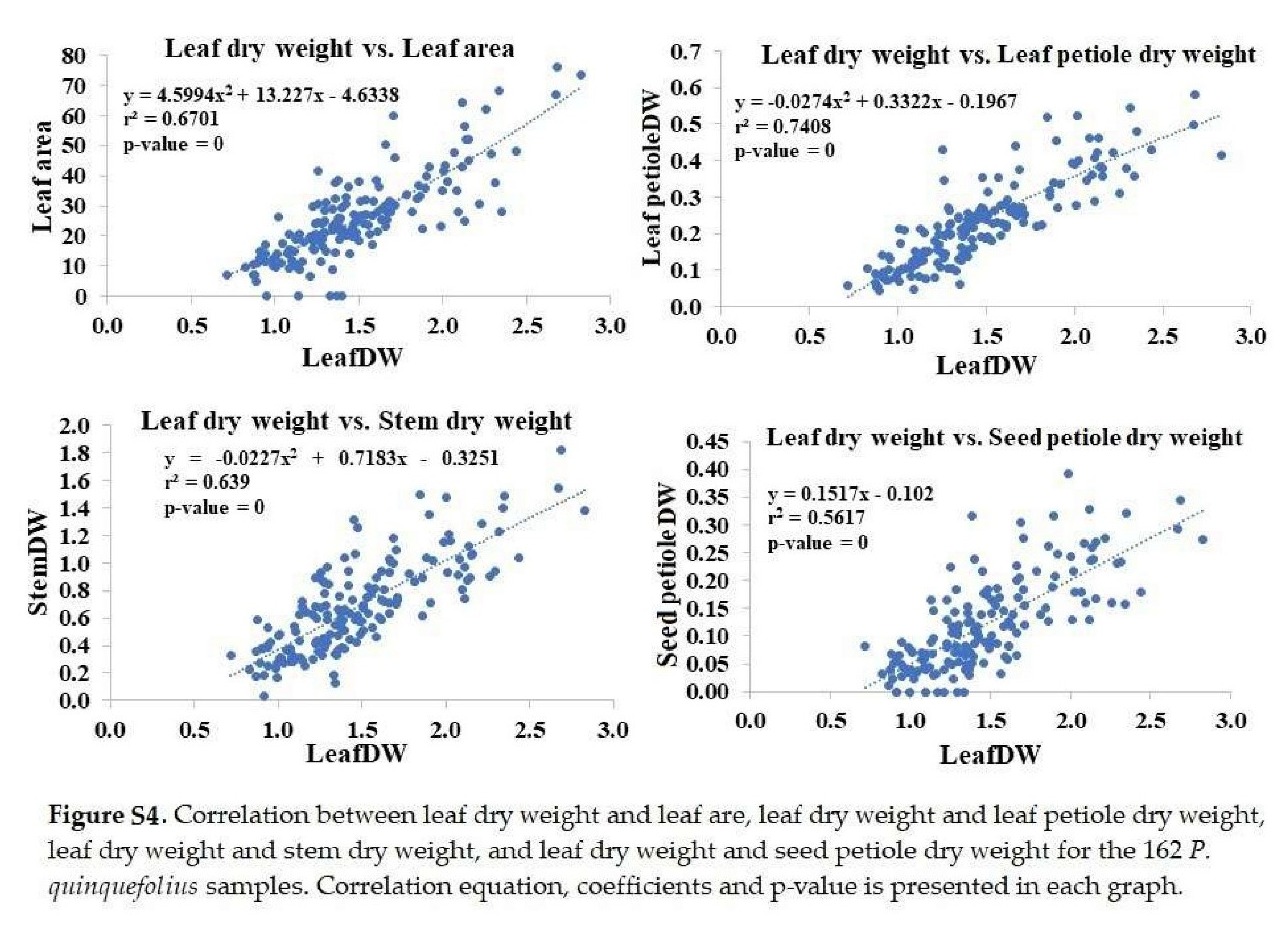
+ Leaf dry weight: Significantly correlated with leaf area, petiole, stem, and seed petiole dry weights (Figure S4).
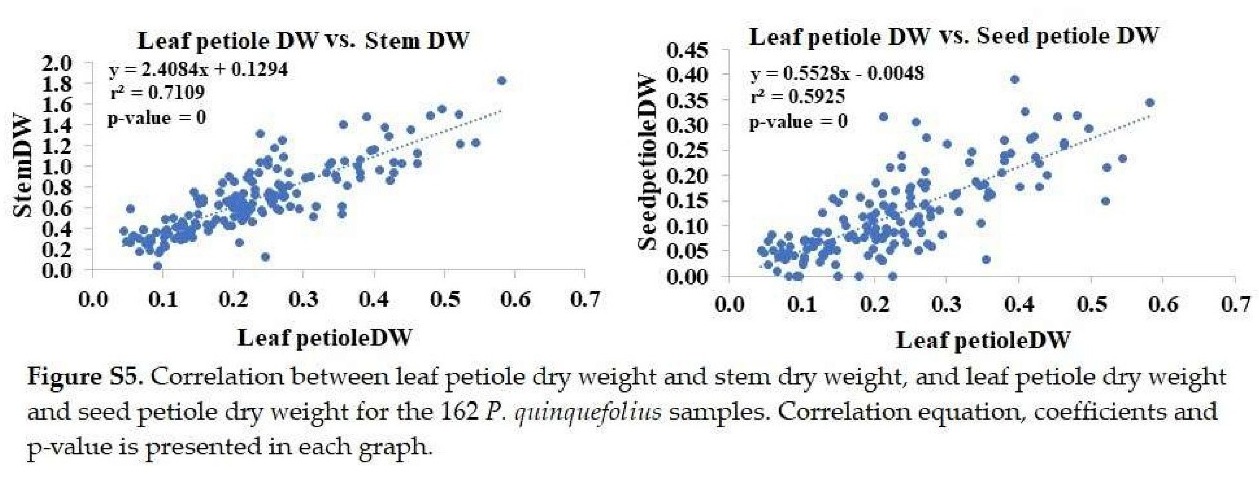
+ Leaf petiole dry weight: Significantly correlated with stem and petiole dry weights (Figure S5).
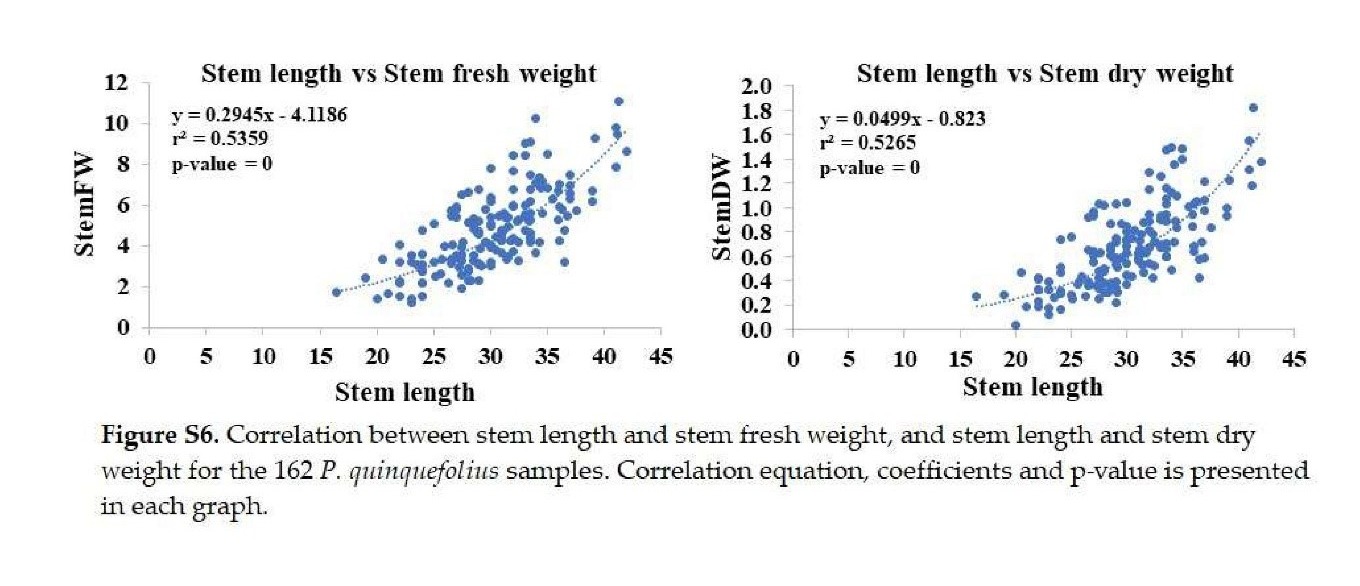
+ stem length: Significantly correlated with stem fresh and dry weights (Figure S6).
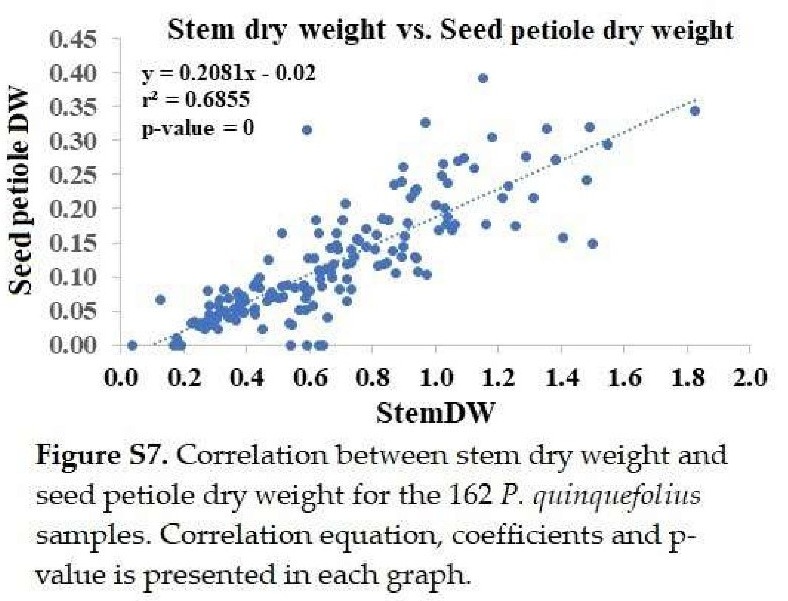
+ stem dry weight: Significantly correlated with seed petiole dry weight (Figure S7).
3. Genetic relatedness of P. Quinquefolius samples
In the 740 bp region amplified with PW16 primers, 52 SNP sites were found among 162 samples, while 586 sites had no SNPs (Figure S8). There were 147 sequence variants, with the most common variant found in 15 samples. Phylogenetic analysis grouped the samples into 22 clusters (PW16-1 to PW16-22) (Figure S9). Most clusters showed high genetic similarity, likely due to proximity and shared seed origin, except for PW16-3, PW16-11, and PW16-22, which displayed higher diversity.
(Figures S8 and S9 can be found in the original article).
4. Genetic relatedness compared to phenotypic parameters
- Group composition:
- Sample sizes per group ranged from 2 to 19 (Table 1).
- All groups included pencil and forked root grades except group 12 (no pencil) and group 20 (no forked).
- Chunk and spider root grades were less common: six groups lacked chunk roots, eight groups lacked spider roots.
- Pencil roots appeared in 50% or more samples in groups 7, 9, 10, 15, 16, 19, 20, 21.
- Chunk roots were in 50% or more of groups 6 and 12.
- Forked roots in 50% or more of groups 12 and 15.
- Spider roots were only in 50% or more of group 3.
- Root weights: No significant differences in root fresh and dry weights among PW16 groups (Table S5).
- Leaf weights: Group 7 had significantly higher leaf fresh and dry weights than group 22 (Table 2).
- Leaf numbers:
- No significant differences in the average number of leaves per plant (Table S5).
- Group 11 had more leaflets per plant than group 3.
- Groups 1, 6, 7, 10, 12, 16, 18, 19, 20 had more leaflets per leaf than group 3 (Table 2).
- Leaf petiole weights: Group 5 had higher petiole fresh weight than group 19 (Table 3).
- Stem characteristics:
- Groups 7, 11, 12 had longer stems than group 19 (Table 3).
- Group 7 had higher stem fresh weights than many other groups.
- Group 7 also had higher stem dry weights than several other groups (Table 3).
- Seed petiole characteristics:
- Groups 1, 5, 6, 7, 11, 15, 16, 22 had longer seed petioles than group 20 (Table 4).
- Groups 1, 5, 7 had higher seed petiole fresh weights than groups 20, 22.
- Group 7 had higher seed petiole dry weight than several other groups (Table 4).
- Seed petiolule and seed numbers:
- Groups 1, 4, 7, 11, 15, 17, 18, 19 had more seed petiolules per plant than groups 12, 20 (Table 4).
- Group 4 had more red seeds per plant than groups 6, 10, 15.
- Group 15 had more green seeds per plant than several other groups (Table 5).
- Groups 3, 4, 15, 18 had more total seeds per plant than groups 10, 19, 22.
- Group 3 had higher total seed fresh weight than groups 1, 10, 19, 20, 22.
- Group 3 also had higher total seed dry weight than groups 10, 19, 20 (Table 5).
Finally, the notable groups included:
- Group 7: High in root fresh/dry weights, leaf fresh/dry weights, stem length, stem fresh/dry weights, and seed petiole fresh/dry weights.
- Group 11: High in root fresh/dry weights and number of leaflets per plant.
- Group 22: Low in root fresh/dry weights, leaf fresh/dry weights, seed petiole fresh/dry weights, green seeds per plant, and total seeds per plant.
(Table 1-5 and Table S5 can be found in the original article)
DISCUSSION
1. Benefits:
- SNPs are a valuable tool in plant genotyping because they are abundant in the genome and can serve as genetic markers for various purposes, such as identifying specific genes related to traits of interest or tracking genetic diversity within a population.
- For ginseng, SNPs have primarily been used to study the genetic uniformity of elite cultivars, founder effects in different populations, the invasion of wild populations by cultivated ones, and comparisons of the diversity of different populations.
- An important advantage of using SNPs in genotyping is their abundance throughout the genome, making them excellent markers for studying genetic variation within populations.
- In this study, the PW16 locus was selected based on its previous demonstration to have a relatively high SNP density among P. quinquefolius samples.
- The proposed function of the PW16 locus is prolyl-tRNA synthetase, which plays a crucial role in protein synthesis by catalyzing the attachment of proline to its corresponding transfer RNA molecule. This enzyme has specific functions related to translation and protein synthesis in plants.
- Phenotyping of the plants in this study was carried out on a wide range of traits of roots, stems, leaves, and seeds of cultivated P. quinquefolius plants.
- The study showed that the 3-year-old plants in this study agree well with the predicted traits, except for shorter stem lengths and lower leaf area.
- This study indicates that there can be considerable diversity in phenotypic traits under cultivation within a population, possibly due to environmental factors, genetic variability, or other influences.
- The classification of the root grades was developed for 3- and 4-year-old plants based on market preferences and was designed to be applicable to nearly all American ginseng roots.
- Significant positive correlations were found between various traits, indicating larger roots and leaves could store more nutrients and support greater growth.
- Other studies quantifying the phenotypic variation of P. quinquefolius have been conducted only for wild populations, providing a basis for comparison.
- Several other studies of the genetic variation of cultivated P. quinquefolius have been conducted, showing that plants under cultivation generally do not have reduced genetic diversity compared to those in wild populations.
- This study has shown that genotyping using SNPs can also show considerable variation and cluster samples, indicating genetic diversity.
2. Drawbacks:
- While a sample size of 162 plants is considerable, expanding the study to include a larger number of plants would provide a more comprehensive understanding of the phenotypic and genetic diversity.
- Only the PW16 locus was examined in this study. Future work could examine SNPs in other genes, which may reveal additional genetic differences.
- The plants were all chosen adjacent to each other under highly similar conditions typical of commercial production. Phenotyping plants under different light intensities, soil fertilities, and temperatures could reveal the impact of those factors on the diversity of phenotypes.
- The study used the PW16 locus as a marker for genetic diversity rather than examining the function of prolyl-tRNA synthetase in plant growth and development, limiting the understanding of this gene's direct effects on phenotypic traits.
- While the study provides insights under specific cultivation conditions, it may not fully capture the diversity and variability that might occur under different environmental settings.
- Results from this study are difficult to relate to other studies where different-aged plants or wild populations with varied environmental conditions were compared.
- The classification of root grades based on market preferences may not fully account for genetic bases or environmental influences on root shapes, possibly leading to biased interpretations.
CONCLUSIONS
The study of genetic diversity and phenotypic variation in cultivated P. quinquefolius plants reveals significant genetic diversity (SNPs at the PW16 locus) and phenotypic diversity (22 morphological traits). Correlations among traits indicate interrelations, suggesting genetic or physiological mechanisms for growth. SNP clustering shows distinct phenotypic groups, highlighting the potential use of markers for selection. These findings have practical implications, such as using stem or leaf weights to predict root weights without soil extraction. As demand for American ginseng grows, leveraging this genetic and phenotypic diversity becomes increasingly vital.
REFERENCES
Abaya, A., Zaro, G. C., De la Mora Pena, A., Hsiang, T., & Goodwin, P. H. (2024). Phenotypic and Genotypic Variation of Cultivated Panax quinquefolius. Plants, 13(2), 300.